Chromatography is a widely used analytical technique in laboratories for separating and analyzing compounds within a mixture. At the heart of this process is the chromatogram, a graphical representation that provides essential information about the components of a sample. Understanding chromatograms is crucial for students, researchers, scientists, and laboratory professionals who work with High-Performance Liquid Chromatography (HPLC). This article aims to elucidate the concept of chromatograms, focusing on the significance of peaks and their interpretation.
What is a Chromatogram?
A chromatogram is a visual output generated by a chromatographic system. It typically consists of a two-dimensional graph where the x-axis represents time (or elution time), while the y-axis displays the detector response, often measured in arbitrary units. Each peak on the chromatogram corresponds to a specific component in the sample being analyzed.
The Components of a Chromatogram
Before delving into peaks, it is essential to understand the basic components of a chromatogram:
- Baseline: The baseline is the flat line that runs horizontally across the chromatogram. It represents the detector’s response when no analyte is present. A stable baseline is crucial for accurate peak interpretation.
- Peaks: Peaks are the most informative part of a chromatogram. Each peak indicates the presence of a different compound within the sample. The height, area, and position of the peak provide valuable information about the compound.
- Retention Time (RT): This is the time it takes for a compound to travel through the column and reach the detector. Each compound has a characteristic retention time under specific conditions, making it a useful parameter for identification.
- Peak Area: The area under a peak correlates to the quantity of the compound present in the sample. Larger areas indicate higher concentrations, while smaller areas suggest lower concentrations.
Interpreting Peaks in Chromatograms
1. Height vs. Area
While both peak height and area provide information about the concentration of a compound, they are not always interchangeable. Peak height may vary with detector sensitivity and flow rate changes, while peak area is generally more consistent and is often preferred for quantitative analysis.
2. Understanding Retention Time
Retention time is a critical parameter for identifying compounds. Each substance will elute at a specific time based on its chemical properties and the conditions of the chromatographic system. To interpret a chromatogram accurately, it is essential to compare the retention times of the observed peaks with those of known standards.
3. Analyzing Peak Shape
The shape of a peak can provide additional insights into the behavior of the analytes. Ideal peaks are symmetrical and Gaussian in shape. Deviations from this shape may indicate issues such as:
- Tailoring Peaks: A peak that tails off may suggest interactions between the analyte and the stationary phase or column packing.
- Fronting Peaks: A peak that fronts may indicate overloading of the column or insufficient resolution.
4. Quantifying Analytes
Quantification involves measuring the area under the peaks and comparing them to a calibration curve derived from known concentrations of standards. This curve allows for the determination of the concentration of unknown samples based on the areas of their respective peaks.
Factors Influencing Peak Formation
Several factors can influence the formation and appearance of peaks in a chromatogram:
1. Column Characteristics
The type of column used, including its length, diameter, and stationary phase, significantly affects peak behavior. Different columns may provide varying resolution and separation of analytes.
2. Mobile Phase Composition
The composition of the mobile phase (the solvent or mixture of solvents that carries the sample through the column) can influence retention times and peak shapes. Changes in pH, ionic strength, or solvent composition can lead to variations in how compounds interact with the stationary phase.
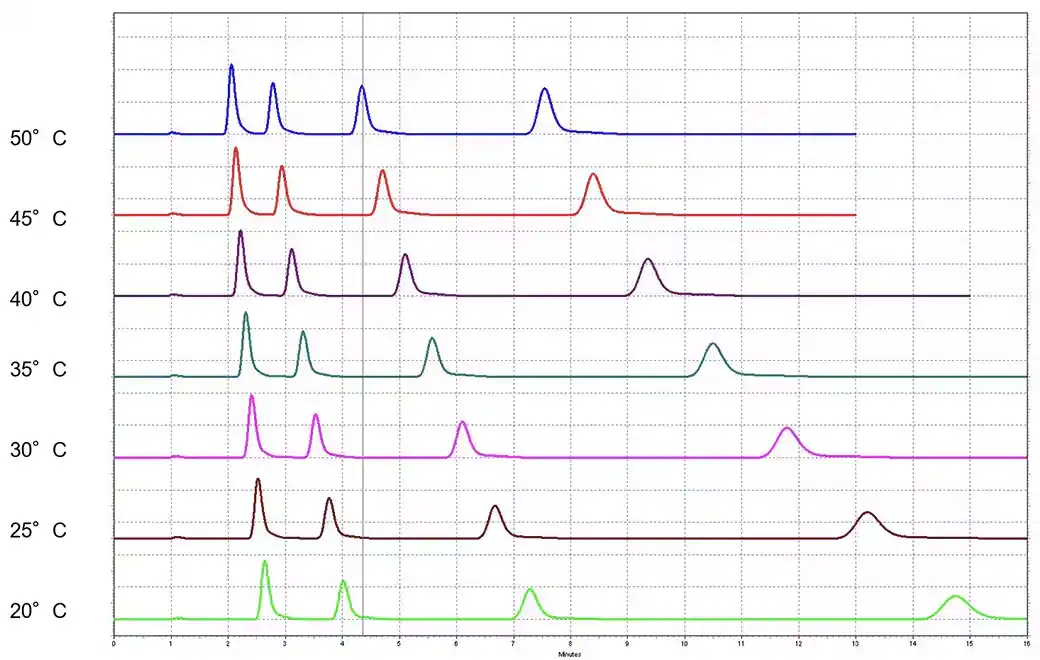
3. Temperature
Temperature affects the viscosity of the mobile phase and the interaction between analytes and the stationary phase. Adjusting temperature can help optimize separation and improve peak resolution.
4. Flow Rate
The flow rate of the mobile phase also impacts retention times and peak shapes. Higher flow rates can lead to shorter retention times, while lower flow rates can enhance resolution but may increase analysis time.
Common Challenges in Chromatogram Interpretation
While chromatograms are powerful tools for analysis, interpreting them can present challenges. Some common issues include:
1. Overlapping Peaks
When two or more peaks are close together, they may overlap, making it difficult to distinguish between them. This phenomenon, known as co-elution, can complicate both identification and quantification. Techniques such as adjusting the mobile phase or using different columns can help resolve overlapping peaks.
2. Noise and Baseline Drift
Noise refers to random fluctuations in the baseline that can obscure peak detection. Baseline drift, on the other hand, is a gradual increase or decrease in the baseline over time. Both issues can affect quantitation and must be addressed through proper instrument calibration and maintenance.
3. Sample Degradation
Some analytes are sensitive to environmental conditions such as light, heat, or air exposure. Degradation can lead to reduced peak intensity or the formation of unexpected peaks. It is essential to handle samples appropriately to preserve their integrity.
Understanding chromatograms and the significance of peaks is fundamental for anyone working in the field of chromatography. The ability to interpret peaks accurately provides valuable insights into the composition of complex mixtures, facilitating quantitative and qualitative analysis. Students, researchers, and lab professionals must familiarize themselves with the various components of a chromatogram, the factors influencing peak formation, and the common challenges encountered during interpretation. By mastering these concepts, individuals can enhance their analytical skills and contribute to advancements in scientific research and application.
As you continue your studies and work with HPLC, remember that each chromatogram tells a story about the sample at hand. Embrace the challenge of interpreting these visual representations, and you will gain a deeper understanding of the intricate world of analytical chemistry.